“….Well inilah penyebabnya mengapa akhirnya Fibonacci menjadi ilmu analisa teknikal khusus, dan bahkan dengan angka akurasi yang membuat kita mungkin tercengang yaitu 96% menurut Jeff Boyd seorang analis forex dalam sebuah artikelnya.”

(selengkapnya baca artikel tentang apa dan bagaimana,analisa Fibonacci? hanya di http://forexanalyze.blogspot.com)

Senin, 31 Maret 2008

Fibonacci: Mengukur Rasio Risk dan Reward

Hal yang tidak kalah pentingnya dalam trading forex adalah perbandingan risk (kerugian) dan reward dalam posisi trading . Dengan penentuan rasio(perbandingan) antara risk dan reward yang tepat akan mendapatkan hasil yang memuaskan dalam setiap trading kita ,dalam menejemen trading, rasio antara risk dan reward disarankan besarnya tidak kurang dari 1:3,artinya dalam setiap trading, kita meresikokan sebanyak 1 poin risk untuk mendapatkan kesempatan reward (profit) sebanyak 3 kalinya.
Dengan Fibonacci kita dapat mengetahui berapa rasio perbandingan antara risk dan reward dalam posisi kita.
Baiklah mari kita lihat ilustrasi berikut:)


Ketika kita meletakkan Fibonacci pada chart, Fibonacci secara otomatis akan menentukan titik extension sebagai target profit yaitu : 0.618, 1.000 dan 1.618 (lihat gambar diatas). Keistimewaaan ini dapat kita gunakan untuk mengkalkulasi rasio profit dan loss yang sanggup kita tanggung.Caranya sederhana,...

1. Amati pergerakan trend yang terjadi uptrend atau downtrend
2. Setelah menemukan trend yang terjadi, cari titik AdanB.
3. Tarik garis Fibonacci dari A ke B,( dari bawah keatas bila uptrend dan atas kebawah bila downtren)
4. Maka platform akan secara otomatis menggambar titik retracement yaitu titik C yang terdiri dari 3 garis lurus
0.382, 0.500 dan 0.618
5. Entry market (buy/sell) di titik C (pilih salah satu yang paling memungkinkan)
kemudian perhatikan gambaran berikut ini:
Misalnya pada chart diatas kita entry buy pada titik C (retracement 0.618) pada posisi
harga 145.60 dan pasang stop loss pada harga 145.20 (yaitu dibawah titik A) baca: " menentukan stop loss dengan Fibonacci" maka loss yang akan kita tanggung ketika stop loss tersentuh adalah 40 pips,dan kita memasang target pada harga 146.80 atau 120 pips baca: " menentukan take profit dengan Fibonacci"maka rasio perbandingan profit (untung) dan Loss (rugi) trading kita adalah 1:3.
artinya dalam trading kita mempunyai kemungkinan kerugian 1/3 dari kemungkinan profit dan kita mempunyai potensi mendapat profit sebanyak 3 kali lipat dari resiko kerugian. Dalam arti kita mampu menerima kerugian sebesar 40 poin dengan harapan mendapat keuntungan 3 kalinya yaitu 120 poin. Sangat imbang bukan? Bayangkan bila anda trading tanpa stop loss?
Misalnya anda mempunyai target untung 30 poin tanpa stop loss itu artinya perbandingan risk dan reward anda adalah 1:~(tak terhingga/Margin call)
yang artinya anda mempunyai potensi untung 30 pips dengan resiko yang anda tanggung sampai terkena Margin Call. Tidak imbang bukan ?
ingat!! perbandingan risk dan reward jangan sampai kurang dari 1:3

be profitable trades!!

Fibonacci: menentukan Stop Loss

Stop Loss digunakan untuk meminimalisir kerugian akibat harga melawan prediksi yang kita lakukan,sehingga denga memasang stop loss akan menghindarkan kita dari kerugian yang lebih besar.
Seorang trader dapat menggunakan Fibbonacci untuk menentukan Stop Loss


Cara meletakkan Stop Loss dengan Fibonacci sbb:
1. Tentukan trend yang terjadi! uptrend atau downtrend?
2. Temukan titik A dan B
3. Tarik garis Fibonacci dari A ke B
4. Hasilnya akan tampak seperti gambar diatas.
5. Atau kalau ingin menghitung manual bisa pakek kalkulator fibonacci (Anda bisa mendownload di halaman lain pada blog ini(forexanalyze.blogspot.com).

keterangan:
Pada contoh diatas kita open buy di titik C 0.618 (retracement) dan memasang Stop Loss sedikit dibawah titik A, sebagai antisipasi terjadinya reversal yaitu jika harga terus turun hingga menembus titik C,kemudian menembus titik A, dan menciptakan trend baru.Jadi dengan memasang stop loss menggunakan Fibonacci kita dapat dengan cepat meminimalisasi kerugian dalam kasus harga gagal melakukan retracement (memantul keatas) sehingga emosi kita dalam melakukan trading tetap terjaga dan tidak terpengaruh disebabkan Loss yang terlalu besar dan atau karena melihat flowting dalam keadaan loss.(pelajari mengontrol emosi dalam trading!)

be profitable trades!!


Fibonacci: Menentukan Open Posisi

  1. Menentukan Titik Open Posisi (Entry)

Entry market atau open posisi adalah hal yang sangat menentukan berhasil tidaknya memperoleh profit dalam trading forex, untuk itu kita harus benar-benar bisa menetukan waktu yang tepat untuk melakukan OP (open posisi).

Fibonacci bisa menolong anda melakukan hal ini:)

Caranya adalah:

  1. Tentukan trend harga pada chart (Uptrend atuo downtrend)
  2. Temukan titik A dan B
  3. Tarik garis dari A menuju B
  4. Maka trading platform akan dengan otomatis menghitung dan menggambar Garis Retracement dan Extension yang masing masing terdiri dari 3 garis.lih. gmbr dibawah!
  5. Atau jika anda ingin menghitung Retracement dan Extension secara manual anda bisa menggunakan kalkulator Fibonacci.


keterangan:
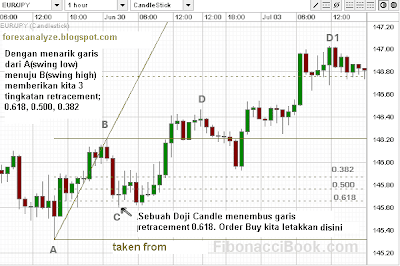
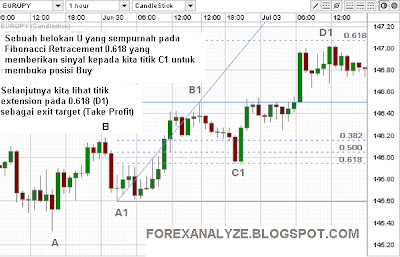
Dari Contoh diatas kita bisa melihat terjadi uptrend
A/A1= swing low, B/B1 = swing high
kita tarik garis dari titik A menuju B, platform akan secara otomatis menggambar titik Retracement yaitu titik C yang terdiri dari 3 garis
yaitu : 0.382, 0.500, 0.618
dari tiga garis retracement pada titik C tersebutlah Fibonacci merekomendasikan kepada kita untuk membuka posisi buy (dalam contoh diatas)
So,..kita bisa memilih satu diantara tiga garis retracement ini untuk open posisi, karena apabila harga telah menembus titik C tersebut harga akan memantul kembali membentuk belokan U.

Namun ada kemungkinan harga tidak mengikuti pola Fibonacci sehingga terjadi reversal (balik arah) harga menembus Retracement 0.618 dan membentuk trend baru yang berlawanan. Dan disinilah pentingnya Stop Loss pada setiap trading kita.

jadi jangan lupa juga pasang stop loss (baca; Fibonacci : memasang Stop LOss)

be profitable trades!!

Fibonacci: Apa itu Fibo?

Harga pasar dalam chart selalu bergerak dengan membentuk pola gelombang keatas dan kebawah yang akhirnya membentuk titik puncak “Swing High” dan lembah “Swing Low”

setelah harga sampai pada titik puncak maka akan kembali turun menuju lembah,untuk selanjutnya kembali lagi membentuk pola gelombang naik turun,pergerakan seperti ini lah yang terjadi pada forex yang mana hal ini berlangsung terus menerus secara dinamis.

Kemudian yang menjadi permasalahan bagi kita adalah kita tidak tahu kemana arah harga kedepan? berjalan kebawah atau keatas? naik atau turun?,dimana kita membuka posisi yang tepat dan menutup posisi yang tepat? padahal hal tersebut adalah akan mempengaruhi hasil trading kita:?

Jangan khawatir Fibonacci dapat menyelesaikan permasalahan tersebut:)

OK..untuk lebih jelasnya marilah kita perhatikan gambar dibawah ini :

dari gambar diatas kita dapat melihat dengan jelas Swing High (harga tertinggi) dan Swing Low (Harga Terendah).

Lalu bagaimana kita menggunakan Fibonacci untuk menganalisa harga?

Caranya mudah sekali.

pertama, kita analisa terlebih dahulu dengan melihat pergerakan harga pada chart(grafik), dari chart kita bisa dengan jelas melihat terjadi uptrend atau downtrend. Seperti pada gambar diatas harga terlihat naik,..jadi telah terjadi uptrend pada pergerakan harga.

kedua, kita cari titik A,B,C,D dalam pola pergerakan harga,kemudian juga kita cari titik A1, B1, C1, D1.

Bagaimana caranya?

Lihat gambar dibawah ini

dari gambar diatas kita bisa melihat titik A,B,C, dan D

A = Swing Low

B = Swing High

C = Retracement

D = Extension

Untuk menggunakan Fibonacci cukup dengan mengetahui titik tersebut…cukup mudah bukan???

Ini adalah tahap pertama kita dalam memanfaat kan Fibonacci untuk menolong kita melakukan trading forex.

Namun sebelum kita lanjutkan mengupas bagaimana menggunakan Fibonacci lebih dalam dan apa saja manfaat yang kita peroleh dari Fibonacci ini mari kita coba melatih kepekaan analisa kita untuk mencari titik A,B,C,D dan A1, B1, C1, D1


Bagaimana?mudah bukan?

Kalau Anda masih mengalami kesulitan berarti anda harus berusaha dulu untuk menguasai poin-poin diatas sebelum berlanjut pembahasan berikutnya.

Namun kalau tetap tidak bisa boleh lho melangkah ke pembahasan selanjutnya..karena disana sudah ada jawabannya :)

be profitable trades!!

FIBONACCI: Asal Usul Fibo

Fibonacci berasal dari nama seorang ahli mathematika terkenal dari Italia Leonardo Pissano Fibonacci, ia menemukan deret angka yang kemudian dinamai dengan nama dirinya “Fibonacci”.

Asal-usul “Deret Fibonacci”

Pada tahun 1240 Fibonacci berusaha menemukan jawaban atas sebuah masalah yang tengah menjadi teka-teki pada waktu itu,yang dikenal dengan masalah kelinci.

Ceritanya begini;” ada sepasang kelinci yang diletakkan didalam ruang tertutup,kemudian yang menjadi pertanyaan berapa pasangkah jumlah kelinci itu selama setahun apabila diasumsikan tiap bulan sepasang kelinci dan sepasang yang lain menghasilkan sepasang lagi dan terus seperti itu ?

Akhirnya Fibonacci berhasil menemukan jawabannya dengan deret angka yang terkenal dengan deret Fibonacci ini yaitu,: 0, 1, 1, 2, 3, 5, 8, 13, 21, 34, 55, 89, 144….dst

Jadi jawabannya adalah 144 pasang.

Lho..kok bisa 144 pasang?mungkin ini yang terbersit dalam pikiran kita.

Angka 144 ini diperoleh dari 89+55=144 tepat pada deret ke-12 dimana angka-angka tersebut diperoleh dari penjumlahan dengan angka sebelumnya.

Masih bingung???

Coba perhatikan angka dibawah ini!

1+2=3, 2+3=5, 3+5=8 dan seterusnya

Nah, usut punya usut rupanya deret yang ditemukan oleh Leonardo Picasso Fibonacci ini bukan hanya memecahkan persoalan Kelinci tetapi menjadi sebuah pola perhitungan dalam ilmu fisika modern khusus cabang chaos theory. Chaos Theory adalah sebuah cabang ilmu matematika dan juga fisika yang membahas sebuah pola pergerakan yang acak namun beraturan. Acak karena tidak pernah menempati titik koordinat yang sama setiap kali bergerak. Beraturan karena selaluberjalan menuju arah yang sama. Nah, yang terjadi pada harga market adalah sama, meskipun harga terlihat tidak beraturan dalam pergerakannya namun harga pasti membentuk pola naik atau turun secara dinamis, maka dari itu para analis teknikal berpendapat pada dasarnya pergerakan mata uang tetaplah memiliki pola yang dapat dilacak. Maka dengan kemampuan Fibonacci memprediksi jumlah kelinci yang akan terjadi pada masa depan padahal waktu itu jumlahnya masih sepasang dengan suatu deret angka yang dikenal dengan "Deret Fibonacci" digunakanlah “Deret Fibonacci”ini untuk mengekstrak pergerakan harga pasar. Well inilah penyebabnya mengapa akhirnya Fibonacci menjadi ilmu analisa teknikal khusus yang handal, dan bahkan dengan akurasi yang membuat kita mungkin tercengang yaitu 96% menurut Jeff Boyd seorang analis forex dalam sebuah artikelnya.

Sekarang mari kita lihat deret Fibonacci sekali lagi:

0,1, 1, 2, 3, 5, 8, 13, 21, 34, 55, 89, 144…

Kalau kita cermati lebih lanjut bahwa perbandingan setiap angka (Un)dengan angka selanjutnya yang lebih tinggi (Un+1) akan menghasilkan 0.618 contoh:21/34=0.618,55/89=0.168

Dan apabila Un dibagi dengan Un+2 akan menghasilkan 0.382,contoh: 13/34=0.382, 34/89=0.382 Atau jika kita rajin membagi deret tertentu dengan deret lainnya maka Anda akan menemukan rasio-rasio lain yang nilainya konstan dari deret ke deret. Sungguh mengagumkan bukan?

Berikut adalah rasio-rasio yang dipakai dalam penggunaan Fibonacci di dunia forex: 0.236, 0.382, 0.500, 0.618, 0.764. Nah dari mana angka-angka itu berasal?, silakan cari sendiri hehehe……

Didalam dunia forex angka-angka 0.236, 0.382, 0.500, 0.618, 0.764 digunakan sebagai Fibonacci Retracement yang berfungsi untuk menentukan titik Resistance dan Support, namun angka yang paling penting untuk diperhatikan dalam chart adalah 0.382, 0.500, 0.618

Dan angka 0.382, 0.500, 0.618, 1.000, 1.382, 1.500, 1.618 digunakan sebagai titik Fibonacci Extension yang berguna untuk menentukan Take Profit, namun angka yang paling penting untuk diperhatikan dalam chart adalah 0.618, 1.000, 1.618

Jadi Fibonacci Retracement dan Fibonacci Extension membawa sebuah informasi yang penting bagi trader untuk mengetahui entry dan exit posisi selama trading.

Dan ingat…menurut Jeff Boyd seorang analis forex dalam sebuah artikelnya Fibonacci memiliki akurasi sebesar 96%...sungguh angka yang luar biasa bukan??

Anda ingin mengetahui lebih lanjut tentang Fibonacci???

Tentu dong…:) he..he..

So ikuti ulasan selanjutnya tentang Mr Fibo ini

Minggu, 30 Maret 2008

Fibonacci :Method in Forex charts

Right to the point

Fibonacci Retracement Levels are:
0.382, 0.500, 0.618 — three the most important levels
Fibonacci retracement levels are used as support and resistance levels.

Fibonacci Extension Levels are:
0.618, 1.000, 1.618 — three the most important levels
Fibonacci extension levels are used as profit taking levels.

So, what we will learn today is how to apply Fibonacci tool and how to interpret results that we see on the screen.

To set up Fibonacci on the chart we need to find out:
1. Is it uptrend or downtrend?
2. Highest and lowest swings in the chart formation (A, B points).
And go with the trend!

So, click on Fibonacci tool from trading platform that you use.


Fibonacci: Is there any suggestion when the market moves sideways?

First of all, when the market is trading sideways there is a very little chance to get rewarded, but there is a huge chance to sustain additional losses. Therefore, no Fibonacci should be applied in sideways market.
Instead, traders should draw two trend lines above and below the price trading range (trend lines will show support and resistance levels) and then place orders when the price breaks out of this levels. That is the only way to trade sideways moving market.
If Forex traders are determined to find a trend, they should switch to a larger time frame.

I still have troubles finding Swings High and Low (A and B points) to draw Fibonacci on...

If you take a group of traders and give them the same chart to define Fibonacci levels you will discover that there are many opinions on where exactly to place Fibonacci study.
Our goal is to find the approach that would be used by majority of Forex traders. This skill comes only with practice.

However, to help you now in your first efforts to define AB swings, lets use couple of tricks, or rather eye guiding tools.

Tool number one will be Stochastic indicator — set full or slow Stochastic with settings 5, 3, 3 or 14, 3, 3, whichever works best for you and use Stochastic lines crossover to find tops and bottoms. E.g. when Stochastic lines cross, mark this point on a bar chart, around this level we will have our Swing High or Swing Low.

Tool number two is Heikin-Ashi candlesticks. Simply switch your charts to display Heikin-ashi bars instead of regular candlesticks. If you don't have such option on your Forex trading platform, use another one from a different broker, for example, Oanda or FXSolutions.
With Heikin-ashi charts price waves become more apparent. Once Heikin-ashi candle changes its color to the opposite (wait till the candle is closed) mark your new level high or low. Once got High and Low pull Fibonacci study with confidence.


Fibonacci: Which currency pairs don't normally follow Fibonacci and which do?

As we mentioned, some pairs aren't very "friendly" to Fibonacci sequence. The only suggestion here would be to avoid trading such pairs. Sometimes it is temporary...

From our observation, USD/CHF is the least obedient pair. Then, unfortunately, EUR/USD has a lot of surprises for Fibonacci traders: Again, this is our point of view.
The most accurate is GBP/JPY and also all other pairs with JPY. Yen is a steady trend-following currency and Fibonacci rules there work perfectly.

You can also do some tests using historical data. Simply scroll the chart back and set Fibonacci on each wave you are able to find for a chosen currency pair. You will see the results for yourself.

Fibonacci: What is the best time frame to use Fibonacci on?

The beauty of Fibonacci method is that you can use it on any time frame. It will work precisely on daily charts, hourly charts and on smaller ones, even 5 and 1 minute! However, the larger the time frame the more accurate results traders can expect.

Traders should always keep an eye on daily Fibonacci — Set and Forget mode.
For intraday trading we would recommend using 3-4 hours or at least 1 hour charts. Going smaller will increase the risks as well as decrease profit expectations.

After calculating risk/reward ratio some entries, stops and profit targets according to Fibonacci rules can be a concerning factor. How to manage this situation?

There are a couple of things traders can do to ensure their risks and rewards are within the money management rules:

1. Entering only on 0.618 retracement — the safest, minimum risk level.

2. Setting a stop loss slightly below (for uptrend) / above (for downtrend) 0.618 retracement — which means that if the price has violated this level and moved further — there will probably be no Fibonacci setup and it is time to exit.
Here traders could choose: exiting with smaller loss and possibly later watching the price reversing and going in their favor, or waiting to collect bigger loss as the price reaches point A of AB swing, but hopefully there will be reverse before this happen...

3. Taking profits slightly before the price comes close to B point (after the retracement) — it will be a 100% level point if to calculate Fibonacci levels. It is the safest "play" — collecting profits before B point. Then, if traders decide to continue trading, they can place another entry when the price manages to pass through that 100% line (pass point B of AB swing). In such way traders could avoid the dangerous zone at B swing where the price, if it is going to be a change in the trend, will reverse and form double-bottom pattern and move against them.

4. Running two orders. Traders may try opening two orders at 0.618 retracement level. Close the first order at the 100% mark (B point), the second — let it run to 0.618 extension and bring a stop loss higher with each progress made. This way traders will collect some sure gains with the first order and if the price continues moving in their favor — they have a potential to benefit even more. However, with such approach traders are also doubling their risks and will colect additional loss if the price moves against them. In such cases when running 2 orders we would suggest exiting at least with one order at the violation of 0.618 retracement and if tolerated wait for price passing A swing to close the second order.

5. And finally: traders should make some statistics about different currencies they've tried, note which one obeys Fibonacci levels best and gives higher chances for profiting. Observant traders will notice that for a particular time frame some currencies may often ignore Fibonacci while other perform very well. This way traders can eliminate additional risks.

Fibonacci: How Accurate Is Fibonacci Study, Does it always work?

Don't be surprised to hear that when used alone, Fibonacci study will be somewhere around 50% accurate. Yes, that's right. If you use only Fibonacci to predict market direction and set your entry, you could be very soon disappointed with overall Fibonacci performance. However, when used in combination with other technical indicators or studies — Fibonacci becomes up to 96% accurate! That's the probability we want you to trade!

So, when do traders use Fibonacci tool? Only when they already know what the market is up to: rising or falling. If it is unclear — they stay out. This means that you shouldn't use Fibonacci to guess on market direction, you should use Fibonacci to confirm your already formed views.

How do traders find what the price "has in mind"? They use additional technical indicators and studies, such as, for example, moving averages, trend lines, Pivot points, chart patterns analysis etc.
When traders can finally tell the direction of the price, only then they set up Fibonacci and look for confirmation and good entry points.

To help you begin your research of useful confirmation tools try setting up RSI (14) on a daily chart. Even if you trade 1 hour chart, RSI should be daily. Watch, if indicator shows below 50, then you can follow Fibonacci signals on 1 hour chart to go short, if above — only long. It won't be an absolute solution to all situations, but can bring Fibonacci effectiveness to a new more successful level.

Sabtu, 29 Maret 2008

FIBONACCI RETRACEMENT

Forex Fibonacci

Leonardo Fibonacci is a famous Italian mathematician, founder of a simple series of numbers that refer to ratios valid for natural proportions of things on the planet. These ratios appear from the next numbers: 0, 1, 1, 2, 3, 5, 8, 13, 21, 34, 55, 89, 144, 233, ..., and found while performing next calculations: 1+2=3, 2+3=5, 3+5=8 etc.

If to measure the ratio of any number to one of the next higher number the result will be 0.618. For example, 21/34=0.618.

If to measure the ratio between alternate numbers we will get 0.382. For example, 13/34 = 0.382.

These proportions can be found in nature, science, architecture, music, art. A few examples of Fibonacci numbers are pine cones, sunflowers, pineapples, palm trees, spider webs, snail shells, DNA molecules and millions of other things in the universe.

When applied on Forex charts, Fibonacci Retracement Levels are used as support and resistance levels: 0.236, 0.382, 0.500, 0.618, 0.764.
0.382, 0.500 and 0.618 — are the most important to watch for.

Fibonacci Extension Levels are used as targets for taking profit: 0.382, 0.500, 0.618, 1.000, 1.382, 1.500, 1.618.
0.618, 1.000 and 1.618 — here are the most useful for traders.

Fibonacci retracement and extension levels carry important information for experienced as well as novice Forex traders as they help to identify entry and exit points during the trade.

This chapter will introduce traders to basic rules of applying Fibonacci method in Forex.

And now let's get straight to the point. Where and how to use Fibonacci study on Forex charts?


As you have noticed, there are some A, B, C, D points on the chart. They represent the highest spikes of the price moves or simply highest price swings. To apply Fibonacci study to the price moves we will always look for those points.

How about a small assignment?..


This is how they should be defined:

So, now being able to find A-B-C-D points we can move on to learning about advantages of using Fibonacci method.

Fibonacci great advantages


1. Fibonacci defines entry points

Take a look how Fibonacci tool was applied on the chart below. (From point A, dragging all the way to point B. Done!) The trading platform will automatically calculate Fibonacci levels for you and draw lines of retracement and extension levels.
If you need to do calculations manually, read How to calculate Fibonacci levels or download Free Forex Fibonacci Calculator.

Once all Fibonacci levels are in place we will look and wait for some good point C to place our BUY order.


Three Fibonacci retracement levels: 0.382, 0.500 and 0.618 — are used as points to enter the trade. Looking at any chart it's obvious that the best entry position would be at the lowest possible swing — e.g. at 0.618 retracement level.

But the price tends to choose different levels to take U-turn from: it can hit 0.382 and go straight back, sometimes it gets to 0.500, and at times it even moves further than 0.618 level before turning back. But still, if the price chooses to respect Fibonacci rules it'll stop at one of those levels and makes its nice U-turn; and Fibonacci traders will already be waiting for this opportunity to enter the trade.


2. Fibonacci Defines Stop Loss Levels

A trader can use Fibonacci numbers to set stop loss orders

In our example, placing buy order at C point and keeping our protective stop slightly below A-swing point protects us from cases when the price eventually fail to rise and continue moving downwards. Then when it finally passes A point, a strong signal of an upcoming trend reversal will be received. In this case we simply cut our losses short.

Setting stops by using Fibonacci method takes emotions out of the trade by giving a pre-defined exit points.

3. Fibonacci Defines Position Size

When plotted on the chart, Fibonacci tool automatically shows price extension levels, around which profits are taken. This feature can be used to determine risks a trader is ready to take in a particular trade. Because we already know where to set a stop loss, we can easily calculate risk/reward ratio — a level of risk versus rewards well known as one of the rules of Forex money management. It is considered wise picking only such trades that promise no less than 1:3 risk/reward ratio.

For example, a trade is worth entering when you have 20 pips of possible losses (in the case of unprofitable trade when a stop loss order is hit), and 60 or more pips of potential wins in the case when the trade turns winning. 20:60 pips is exactly 1:3 risk/reward ration.

4. Fibonacci Defines Profit taking levels — sets objectives


Fibonacci extension levels — 0.618, 1.000 and 1.618 — are used to set profit goals. After placing entry orders traders simply need to look at extension levels and set «take profit»/ «close trade» orders. In more than 50% of cases traders tend to choose 0.618 extension level as a primary target to lock in profits. If the market is very active, traders can simply reset their positions and ride the market further to the next 1.000 or even 1.618 Fibonacci extension level.
Note, that 0.618, 1.000 and 1.618 extension levels are calculated in relation to B point on the chart, which means that B point is a 0% extension.

For traders who like to take additional protective steps and trade safe, there is one more point to consider such as locking in some partial profits during the trade.


If we return to the moment when price has just reached the mark of old B point, we should remind ourselves that in order to confirm its uptrend (as shown in our case) the price will need to pass old B point (B swing high) and move further up.

Violation to pass B point will create a double-top formation, which is a strong signal of potential trend reversal. That's why locking some partial profits at this old B point will make our trade profitable even if the market decides to turn in the opposite direction.


5. Fibonacci method can be double strengthened by applying two or more retracements at once

Although Fibonacci method has its defined rules, many traders worldwide are using their own combined styles and approaches, not to mention set different objectives for every particular trade. Considering that some Fibonacci traders might be more comfortable with plotting two or more Fibonacci retracements to see where interests of majority of traders are merging.

And so, merging retracement levels would show more potential to become the U-turn points for the market. Same idea could also be used for setting profit targets. Here traders should closely watch the market behavior and tighten their protective profitable stops when the price gets closer to the initial profit target zone. The other option is simply to opt for the lowest extension level and trade safe.

Profitable trades!

by Jeff Boyd